fetching data ... 
Background: Rheumatic diseases are an important cause of morbidity worldwide; approximately 10 to 20% of the general population suffer from rheumatic diseases. They also count as the main cause of disability worldwide, according to data from the World Health Organization, by 2021 approximately 1.71 billion rheumatic patients will have musculoskeletal diseases in the world. In Colombia, rheumatoid arthritis is among the most prevalent inflammatory rheumatic diseases, with a reported prevalence of 0.5%. And the limited number of rheumatologists is challenging for managing these chronic conditions in this country. In fact, there is a need for innovative solutions to improve patient care. To prevent complications and reduce costs by these chronic diseases, the follow-up in these patients is crucial and existing electronic medical records (EMR) are an essential component. A good way to keep information data updated and have real time metrics of patients is a dashboard. Dashboards are electronic tools used nowadays to have a graphic vision of real time reporting data. The importance of dashboards lies in the support it gives when identifying patterns, it also provides as a guide to make decisions. An example of this is the use and the importance it has risen in public health, as a guide to determine where and among whom resources should be priorized. Also, its implementation to conduct syndromic surveillance and notifiable disease reporting has taken hold.
Objectives: This report describes our experience in collecting (EMR) notes and creating a dashboard for a local information system of rheumatologic patients and their diseases, characterizing the population to have an insight into autoimmune diseases in the Rheumatology Department of a tertiary hospital.
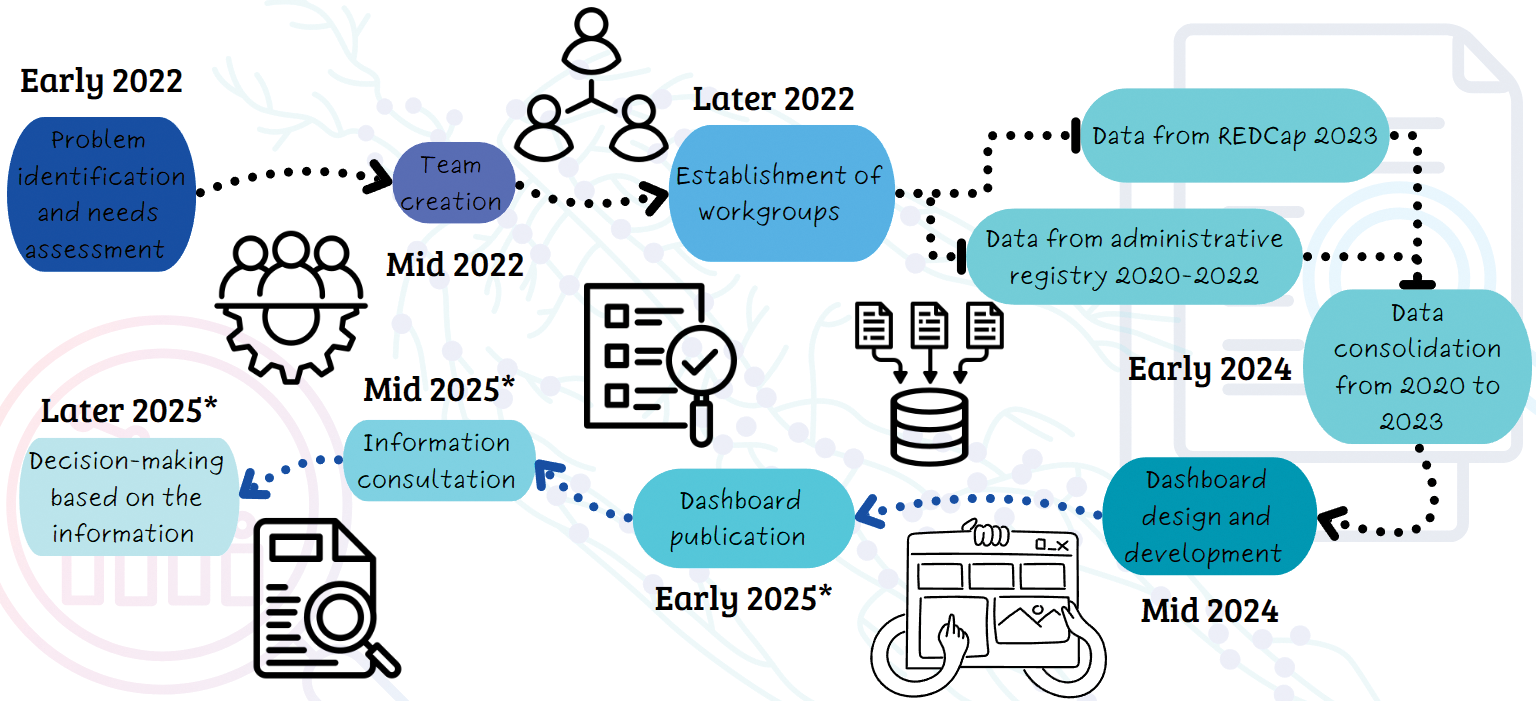
Methods: Rheumatology Department of a tertiary hospital. Methods: The dashboard was built using administrative records from the rheumatology department of the hospital. Two sources of information were identified, administrative sources (patient care billing records and variables from the administrative source, information of the billing system and the method of recordkeeping) from 2020-2022 and data from the RedCap® (Research Electronic Data Capture) software for 2023 from the Rheumatology Department of Hospital San José were used to create a dashboard. Similarly, clinical records maintained in the EMR system were revised, in compliance with Colombian law (Law 15 of 2020). This law states the criteria for the registration and storage of information in Colombia. The metrics were consultations per month (2020-2023), the number of patients attended, demographic characteristics of the population, ICD-10 (International Statistical Classification of Diseases and Related Health Problems), and the presence of comorbidities were prioritized for visualization. The dashboard was built using Looker Studio, with SQL (Structured Query Language) queries enabling real-time data analysis, Image 1.
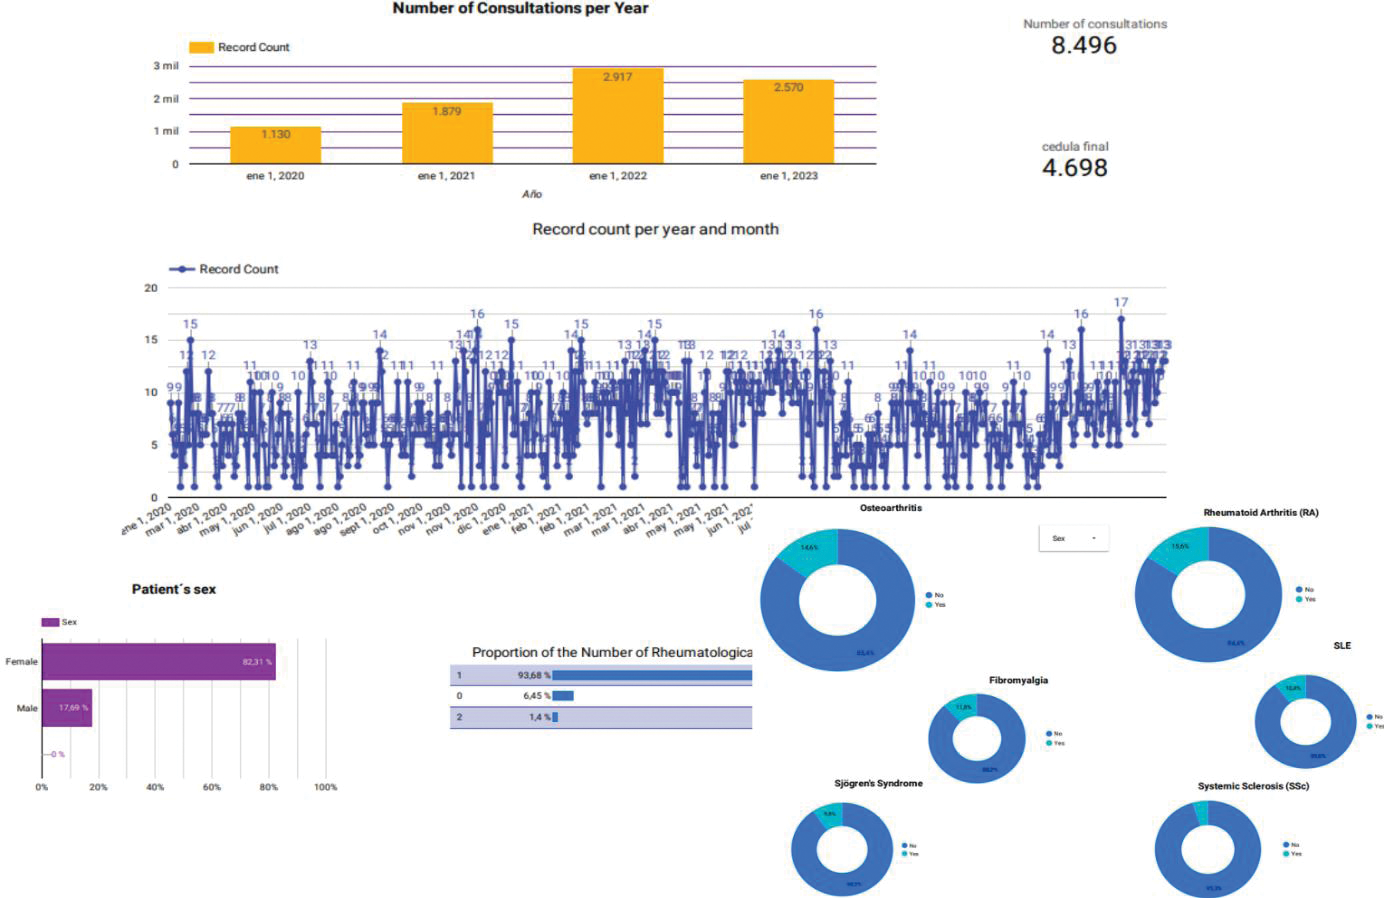
Results: On the dashboard, from 2020 to 2023, there were 8,496 consultations from 4,698 patients, in 2020, there were 1,130 consultations, in 2021 there were 1,879 consultations, in 2022 there were 2,917 consultations, and in 2023 there were 2,570 consultations, On page 2 of the dashboard, the most diagnosed diseases in the rheumatology service are displayed, with Rheumatoid Arthritis being the most diagnosed with 15.6%, followed by Osteoarthritis representing 14.6%, Fibromyalgia with 11.8%, Systemic Lupus Erythematosus (SLE) with 10.4%, Sjögren’s Syndrome with 9.8%, and Systemic Sclerosis (SSc) with 4.7%. These six diseases account for 66.9% of the diagnoses in the rheumatology service between 2020 and 2023. Additionally, female patients represent 82.31%, while males account for 17.69%. It is also noted that 1.4% of patients have more than one rheumatological diagnosis (polyautoimmunity) Image 2.
Conclusion: The implementation of a clinical dashboard has significantly improved patient follow-up and research capabilities. This initiative demonstrates the potential of integrating technology to address resource limitations in lower-middle-income countries, serving as a replicable model for advancing rheumatologic care. Additionally, when RedCap® software started being used (data since 2023), it was possible to record more than one diagnosis, allowing for greater data capture regarding polyautoimmunity and comorbidities. This initiative addresses several key challenges faced by the department, including fragmented data collection, the high burden of rheumatic diseases. The department has established a system that enhances clinical workflows and provides a platform for real-time data analysis, decision-making, and research in the future.
Timeline describing the process of creating and developing the dashboard and the plan for the future (2025*) at the rheumatology department of San Jose Hospital, in Bogotá Colombia.
The dashboard of the Rheumatology Service of San José Hospital, Showing the Number of consultations and Patients from 2020 to 2023, The most prevalent rheumatologic diseases (filtered by sex) and patients with more than one rheumatologic disease.
REFERENCES: NIL.
Acknowledgements: NIL.
Disclosure of Interests: None declared.
© The Authors 2025. This abstract is an open access article published in Annals of Rheumatic Diseases under the CC BY-NC-ND license (